已知函数f(x),可以用插值法或牛顿迭代法求x(f)。如果x和f(x)存在一对多的情况,x(f)就不是函数,要注意选取合适的域来避免这个情况。
插值法就是将输入的坐标用一个函数串起来。我们输入一系列的坐标(x,f(x)),那么x(f)的函数就是 scipy.interpolate.interp1d(x, f, kind="cubic")
举一个例子,已知\(a(t)=t^{2}+t\),求\(t(a)\)
[code language=python]
import numpy as np
from scipy.interpolate import interp1d
import matplotlib.pyplot as plt
def aoft(t):
return t**2+t
t = np.linspace(0,2,10)
a =aoft(t)
tofa = interp1d(a, t, kind=”cubic”)
print(tofa(5),tofa(5)**2+tofa(5))
[/code]
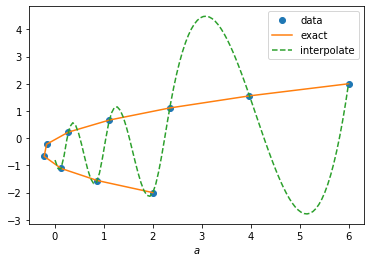
注意第六行,为了t(a)是函数,t取了大于0的情况。如果把第六行的取值范围改为-2到2,t(a)出来就是这样的:
[code language=python]
import numpy as np
from scipy.interpolate import interp1d
import matplotlib.pyplot as plt
def aoft(t):
return t**2+t
t = np.linspace(-2,2,10)
a =aoft(t)
tofa = interp1d(a, t, kind=”cubic”)
aa=np.linspace(0,6,100)
plt.plot(a,t,”o”,a,t,aa,tofa(aa),”–“)
plt.xlabel(r’$a$’)
plt.legend([‘data’,’exact’, ‘interpolate’], loc=’best’)
plt.show()
[/code]
牛顿迭代法解决的是已知f(x)=0,求x的问题。
首先我们需要猜一个解,\(x=x_{0}\)
然后,不停地计算\(x_{0}=x_0-\frac{f(x_0)}{f'(x_0)}\)
直到\(f(x_0)=0\)
这时\(x_{0}\)就是所求的解。
对于多根的方程,最开始猜的值不同,可能会得到不同的解。
例如,我需要解\(a(t)=t^{2}+t=5\)的解,对应的python代码是
[code language=python]
def aoft(t):
return t**2+t
def tofa(a):
t = a**.5 #猜值
def func(t):
return aoft(t)-a
for i in range(40):
if(abs(func(t))<1e-6):break
t = t-func(t)**2/(func(t+func(t))-func(t))
if(i==39):print(“for a: “,a,”, the t_a finder does not converge\n”)
return t
print(tofa(5),tofa(5)**2+tofa(5))
[/code]
如果想输入一系列的a得到对应的t,可以这样写
[code language=python]
def tofan(a):
def aoft(t):
return t**2+t
def tofa(a):
t = -1 #猜值
def func(t):
return aoft(t)-a
for i in range(40):
if(abs(func(t))<1e-6):
#print(“for a: “,a,”, the t_a : “,t,” finder is convergent”)
break
t = t-func(t)**2/(func(t+func(t))-func(t))
if(i==39):
print(“for a: “,a,”, the t_a: “,t,”, finder does not converge!\n”)
return t
if(type(a)==np.ndarray):
tofa = [tofa(an) for an in a]
return(np.array(tofa))
else:
return tofa(a)
a = np.linspace(0,10,1000)
plt.plot(a,tofan(a))
[/code]
t的猜值大于0和小于0的图不一样,大家可以试试。
例子的函数很简单,我们直接画图比较一下
[code language=python]
import matplotlib.pyplot as plt
import numpy as np
x=np.arange(-5,4,0.01)
y=np.arange(-1,10,0.01)# 转化为网格
x,y=np.meshgrid(x,y)
z=x**2+x-y
plt.contour(y,x,z,0)
[/code]